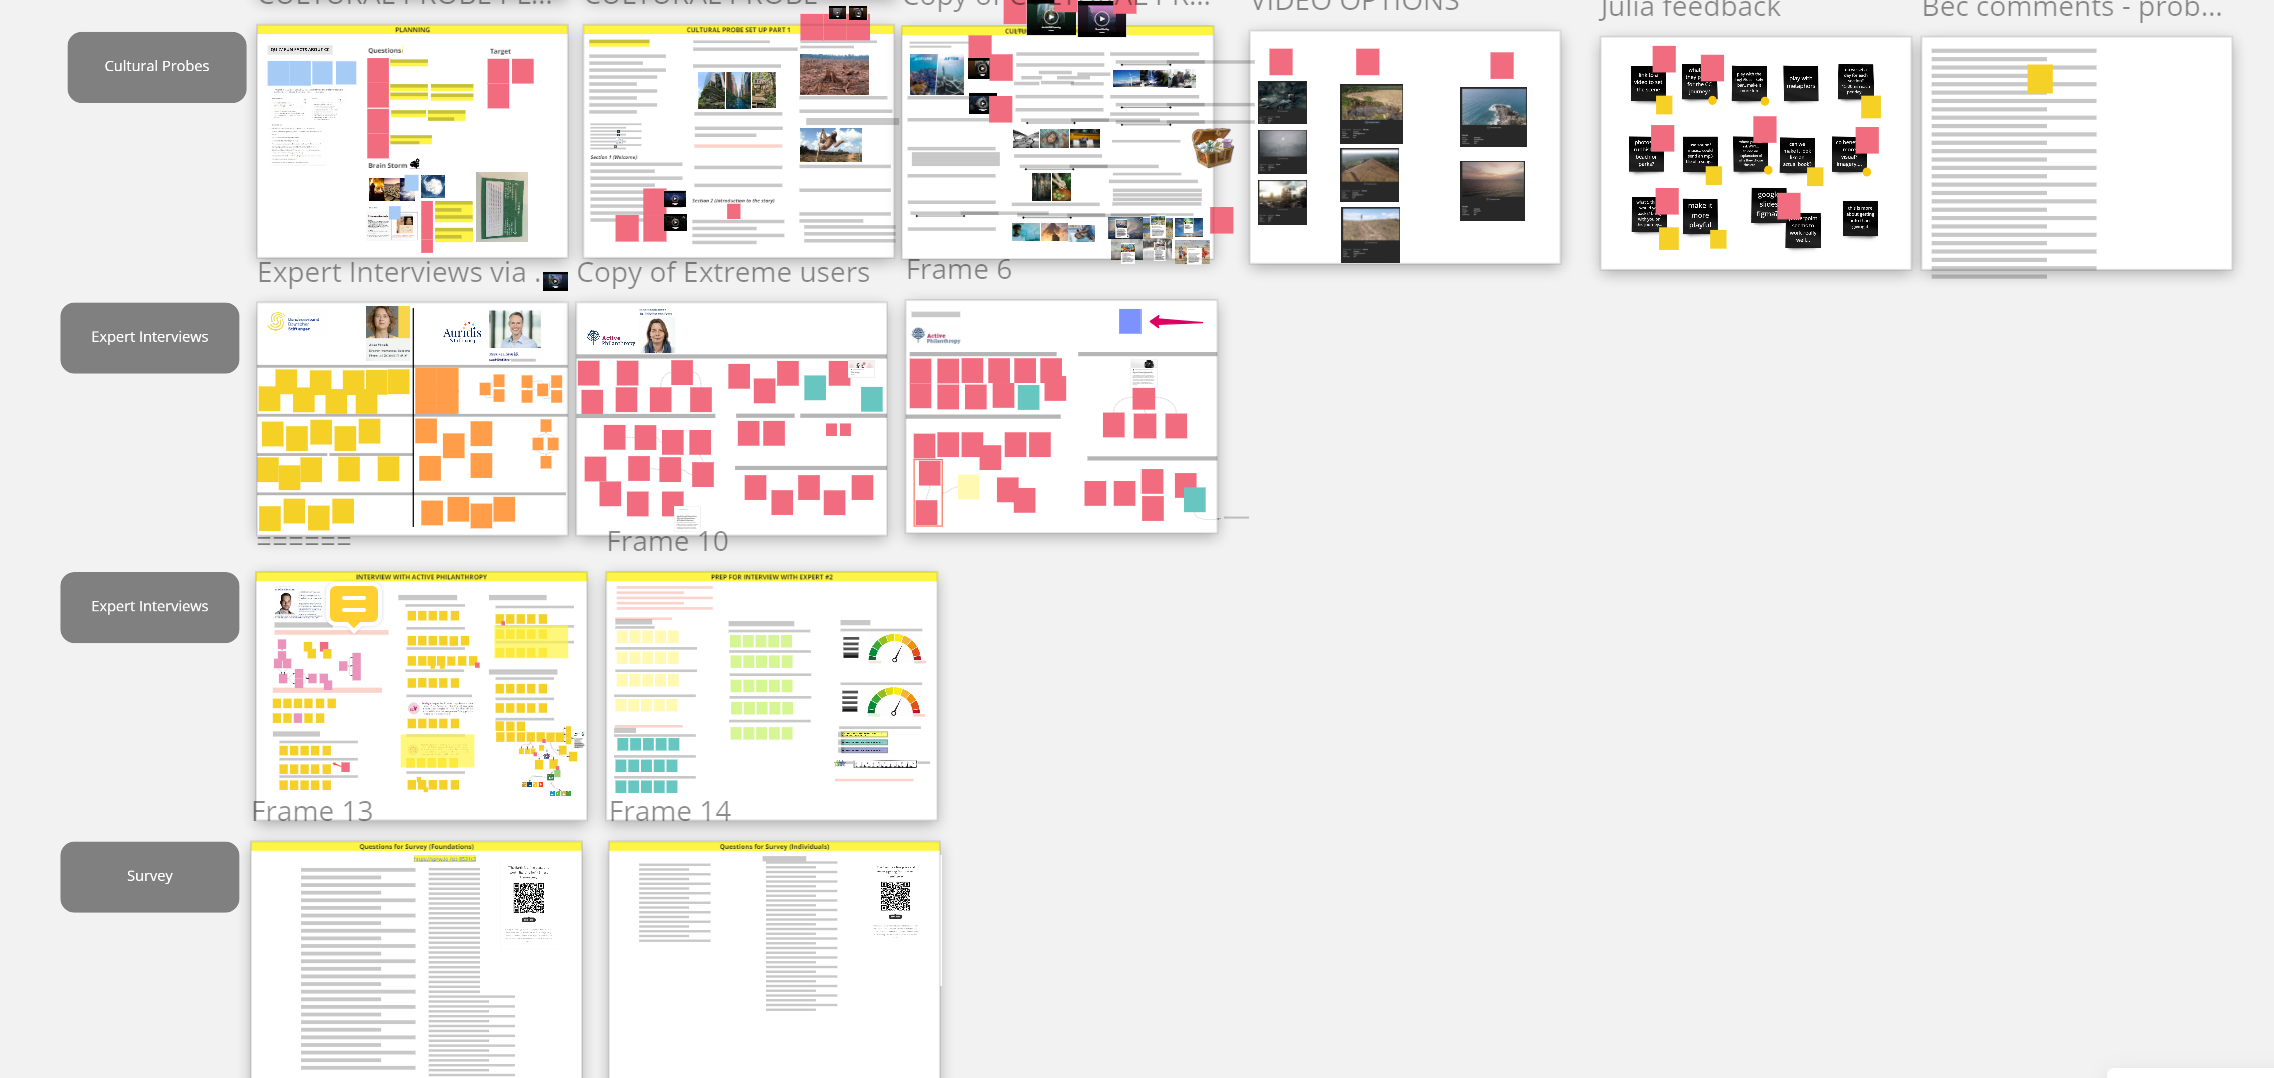
Research Mapping.
Research can get very messy very quickly :(. But, if you map where your research data should be placed and categorize them accordingly then it makes life a lot easier. This tool will help you organize your research making it easier to refer and trace the source of your vital information.
Time Taken
1-2 hours
Level of Difficulty
Easy
Materials Needed
Sticky notes, boards, frames, pens
Partcipants
Design/Research Team
- Effectiveness 80%
Step by Step Instructions
#1
Decide if you want to create a physical or digital research map. I created a digital version, so my recommendation would be MIRO for the same. (Refer the template).
#2
Create rows for each research step like desk research, cultural probe, etc (explained as separate tools). Name each row/steps.
#3
Create frames as columns for each row if you have multiple subjects for each steps, like desk research 1, desk research 2, etc.
#4
Fill the frames with your research data as sticky notes, texts, images, videos etc.
#5
Make sure to name and number the steps and frames correctly if the research data becomes too huge.
Template
View/download the template to better understand how the tool works and use it accordingly. The template is only for reference, you can modify the structure to better suit your requirements.
How did I use it?
This tool came in handy for the research phase of my MA Strategic Design 1st semester. The project was related to climate change and as a team(3 members) we were able to collect huge amount of data on the subject, requirement, client and target group.
By mapping each data point to which step, method and source it originated from, we were able to make faster strides to the next design phase.

